Very Low Volume Applications In An Apple Orchard By An Air-Carrier Sprayer With Four Electrostatic Twin-Fluid Nozzles

Electrostatic University of Padua Italy

Very Low Volume Applications In An Apple Orchard By An Air-Carrier Sprayer With Four Electrostatic Twin-Fluid Nozzles

Very Low Volume Applications In An Apple Orchard By An Air-Carrier Sprayer With Four Electrostatic Twin-Fluid Nozzles (*)
Cesare De Zanche, Dario Friso (**)
Department for the Territory and Agri-Forestry Systems
Mechanization and Plant Engineering Section
University of Padua (Italy)

You can download the .pdf file clicking on the link:
Electrostatic_University_of_Padua_Italy_mod

Summary
A field test using an air-carrier sprayer with four electrostatic twin-fluid nozzles (A) was conducted.
This machine was adjusted so as to distribute a very low volume in an apple orchard.
Distribution quality was assessed, with particular reference to drift and losses on the soil.
To obtain a complete comparison, an air-carrier sprayer with hydraulic nozzles and axial fan (B) and an air-carrier sprayer with hydraulic nozzles and centrifugal fan (C) were also tested. Both machines functioned with a high volume.
The trials were conducted by using water-sensitive collectors and the data (covered area, number of droplets and VMO) were obtained by using an image analyzer.
Subsequently, a covered area contour map on a vertical plane, crosswise to the tree crop rows, was made for each sprayer so as to represent the dimensional planes of the areas covered in percentage terms by the droplets sprayed by the three machines and to assess the drift and losses of liquid on the soil. Assessments were also made of the plant health aspects by checking the crop subjected to the various different treatments.
However, comparisons were only made between sprayers A and B.

The results obtained as to the distribution dynamics were clearly in favour of machine A. As regards plant health, this machine provided effects that were similar to the conventional one and its efficacy against aphids and apple scab actually proved to be significantly superior.

Introduction
Besides aspects of a functional type concerning the spraying equipment (such as use of volumes reduced to suit the characteristics of the crops, the pests involved, the type of plant protection product used and the method for breaking up and distributing the droplets), the need to lessen drift and losses on the soil when plant protection products are applied to fruit crops in this particular case, must also involve geometric-constructional aspects with a view to evening out the distances between the dispensing points of the machines and the actual crop itself.

Thus certain tests were conducted to identify a better geometric position for the nozzles of a spraying machine featuring a pneumatic atomising system with electrostatic charge able, from the functional aspect, to reduce drift and losses on the soil thanks to the remarkably low volume with which it was able to work while maintaining an ample safety margin when it came to the efficacy of the treatments (Cesari et al., 1986, 1990).

Materials and Methods
Work was carried out during 1990 in the I. Masotto farm situated in Zevio (VR) and concerned apple crops of the Golden Delicious cultivar (grade B) on E.M.9 rootstock, cultivated in the spindlebush mode with 4.10×1.40 m planting distance and rows pointing North-South. The average age of the trees was 5 years and they were up to 3.5-4.0 m in height, depending on the growth period.

The plot of land used during the tests was divided into two parcels measuring 9,500 and 6.300 m², which were treated with machines A and B, respectively.

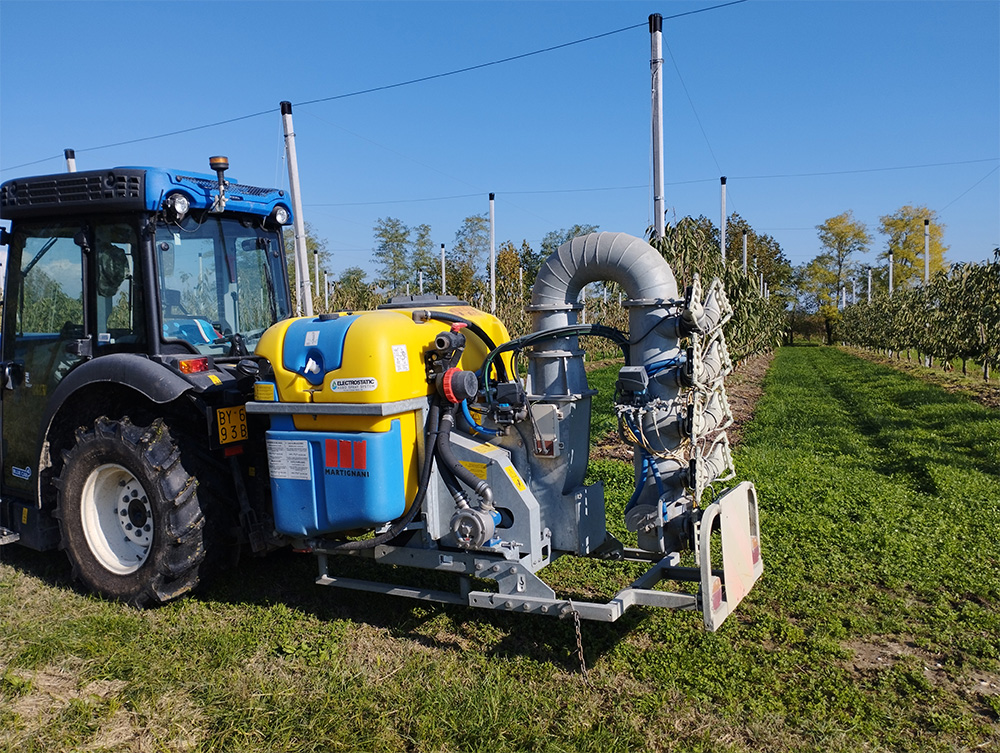
The former machine (A) was a KWH-Martignani towed sprayer with split dispensing system and two distribution units, one in a low position according to the conventional configuration and the other in a high position (fig. 1).

The two spraying nozzles of the lower unit were at a fixed height (45 cm from the ground) and were positionable on the vertical crosswise plane while the upper ones were also positionable in this way as well as being adjustable in height (260 cm from ground level in the tests) and positionable on the horizontal plane (40° in the backward direction during the tests).

Since the sprayer was the pneumatic atomiser type, the fan, which was in a central position behind the tank, was centrifugal with a 25,000 m³/h total nominal flow rate. This remarkable value, actually necessary in view of the split spraying nozzle system, was achieved thanks to the rate at which the impeller turned (314 rad/s, i.e. 3000 rpm). This rate was obtained with the PTO at 56 rad/s (540 rpm) and a double suction impeller, thus with double blading. The flow created, which could also be regulated, was then distributed in a vertical current so as to supply the upper units and in a horizontal current for the lower ones.
The two flows were then switched to the individual spraying nozzles.

The low pressure centrifugal fluid pump routed the mixture to four nozzles (one for each distribution unit) equipped with a graduated scale on which a pointer was positioned.
This allowed the overall fluid flow rate to be adjusted from 150 to 4800 dm³/h in a very precise way, another positive characteristic of the machine.
Moreover, there was a device for electrostatically charging the droplets for each pair of distribution units.

The system was complete with two fibreglass-reinforced plastic tanks, each of which with a capacity of 250 dm³ and its own filling
port.

Figure 1: the Martignani low volume air-carrier sprayer with electrostatic twin-fluid nozzles.
In the diagram on the left, the arrows indicate the positions in which the four spraying nozzles could be adjusted.

The second machine (B), owned by the farm, was a self-propelled mixed atomiser with a 2,000 dm³ capacity fibreglass-reinforced plastic tank, two centrifugal fans (one on each side), a 30,000 m³/h total air flow rate, 7 open cone nozzles on the right-hand side and 8 cone nozzles on the left-hand side with 1.5 mm diameter washers except for the two lower nozzles whose diameter was 1.2 mm.

The machine functioned with 1,500 dm³/ha volume and 18 bar operating pressure. It advanced at a speed of 5.8 kph.

The effects of the treatments applied by the two machines were assessed on infestations of rosy apple aphid (Dysaphis plantaginea), fruit tortrix (Eulia pulchellana) and on secondary infestations of apple scab (Venturia inaequalis).

The treatment against rosy apple aphid was applied on 11 May following an attack that was superior to the after blossoming tolerance level, i.e. 2% of the shoots were affected. A 2.15 kg/ha dose of a 38.5% Ethiofencarb-based product was used. 165 dm³/ha of the mixture was sprayed by machine A and 1500 dm³/ha with machine B.

Besides being subjected to a first treatment on 5 May (which could not be assessed since there were very few larvae present), a further specific treatment against the second generation of Eulia larvae was carried out on 30 June and against the third generation on 20 August.
A product based on 22.1% Chlorpyrifos-methyl was used in both cases. A 2.25 dm³/ha dose was used against the second generation of which 160 dm³/ha was applied with machine A and 1500 with machine B while on 20 August, a 3.0 dm³/ha dose was applied with both the low volume machine and the one that operated with normal volumes.

The quantity of Chlorpyrifos-methyl on the fruit was assessed 15 hours after this last treatment.

Only the secondary summer infections of apple scab were assessed as machine A had only been available from the month of May onwards, after the main spring infections had already occurred. These assessments were made after the treatments of 19, 23 and 29 May.
These treatments had been indispensable owing to the infected rain that fell from 17 to 29 May. 80% strength Captan was used on 19 and 29 May at the dose of 2.25 kg/ha, by spraying 160 dm³/ha and 1500 dm³/ha with the farm’s machine. 75% strength Dithianon was used on 23 May when a 1.12 kg/ha dose was applied using both machines.

The apple scab control was conducted on 20 June when fresh blotches were discovered on the last 5 apical leaves of the shoots.

To ascertain the distribution dynamics, tests were conducted at the end of July to assess how the droplets, consisting of water alone in this case, were dispersed on the ground and in the air.
These assessments were made with a series of water-sensitive collectors, as illustrated in the diagram of figure 2.

Figure 2: Diagram (one site) of the spatial distribution of the water-sensitive collectors used to assess droplet distribution.
The same paper cards can also be partially seen in the bottom diagram, which highlights the staggered pattern that prevents future interference in droplet captation.

The distribution characteristics, i.e. the number of droplets per unit of area, the diameter of the droplets and the area covered, were successively assessed by means of the water-sensitive collectors, using a Zeiss mod. IBAS image analyzer comprising a stereo-microscope, a television camera and a computer with relative software.

To achieve an even more complete comparison, besides comparing the two previously described machines, a conventional sprayer (C) was also tested, obviously in relation to distribution dynamics alone.
This sprayer featured mechanical atomisation with full cone nozzles and 1500 dm³/ha distributed volume.
The droplets were conveyed by means of an air flow typically created by an axial fan, with a 40,000 m³/h flow rate in this particular case.

Results
Phytopathological aspects

Sprayer A
Sprayer B
shoots with live aphids (%)

0-1 m 1-2 int. m 1-2 ext. m 2-3 m
assessment height (m)

Figure 3: percentage of shoots with live aphids 4 days after treatment

Sprayer A
Sprayer B
live adult aphids per shoot (N°)

0-1 m 1-2 int. m 1-2 ext. m 2-3 m
assessment height (m)

Figure 4: average number of live aphids per shoot observed 4 days after treatment and counted on the last 3 leaves of 100 infested shoots

As can be seen in from the histograms of figures 3 and 4, the efficacy of the treatment against colonies of rosy apple aphids was significantly superior when machine
A was used, i.e. the machine that operated with a low volume, positionable jet, pneumatic atomisation and an electrostatic charge.
This result was even better on the external part of the foliage.
The results of the treatment against Eulia larvae given in figures 5 and 6 concerning control of the 2nd and 3rd generation, respectively, show that there were no significant differences in the efficacy of the treatments applied by the two machines and that in both cases, the few live larvae found during the control were concealed between two leaves.
The results of the analyses of the residues in the fruit 15 hours after treatment with chlorpyrifos-methyl showed differences that were of no significance, thus further problems with chemical residues were not created by the higher concentration of the mixture sprayed by machine A.

Lastly, the control of the effects of the treatment against apple scab showed (fig. 7) that the low volume pneumatic machine A was more efficacious than the conventional machine B with the exception of the lower part of the foliage, where the differences were not
significant.

Sprayer A
Sprayer B
dead larvae (%)

0-1 m 1-2 int. m 1-2 ext. m 2-3 m
assessment height (m)

Figure 5: control of second generation Eulia larvae 2 days after the treatment of 30 June

Sprayer A
Sprayer B
dead larvae (%)

0-1 m 1-2 int. m 1-2 ext. m 2-3 m
assessment height (m)

Figure 6: control of third generation Eulia larvae 2 days after the treatment of 20 August

Sprayer A
Sprayer B
leaves affected by the infection (%)

0-1 m 1-2 int. m 1-2 ext. m 2-3 m
assessment height (m)

Figure 7: control of apple scab blotches on the leaves on 20 June (sample of 200 leaves per assessment)

Dynamic aspects of distribution
Computer processing of the data obtained from the water-sensitive collectors, particularly in relation to percentage coverage, allowed us to create cross-section diagrams of the rows similar to the one given in figure 2, which also shows the isocoverage curves, i.e. places in the plane vertical-transversal to the rows where the actual coverage values are the same.
In other words, considering any point of the diagram, the iso-coverage curve that passes over it gives the value of the percentage of covered surface of a leaf or of any other flat object physically present in that point or ideally in that position.

Spray A drift and losses on the soil
The first diagram shown in figure 8 refers to sprayer A using water alone at 150 dm³/ha in climatic conditions featuring a temperature of 26°C, 79% humidity and a 0.5 m/s breeze blowing in the north-east direction (measured at a height of 2 m in the open field), thus slanting 40° in relation to the south-north position of the
rows.

t = 26°C
79% R.H
wind 0.5 m/s

Figure 8: iso-coverage curves (dimensioned plane) obtained by computer processing the assessments made with the aid of water-sensitive collectors and concerning pneumatic sprayer
A operating at 150 dm³/ha. The numbers alongside the curves represent the percentage values of
coverage.

t = 29°C
50% R.H.
wind 1 m/s

Figure 9: dimensioned plane of the percentage coverage of the distribution achieved by conventional atomiser C at 1500 dm³/ha.

The graph shows a substantially symmetrical group of curves as compared to the inter-row space where the machine passed through, with a slight deviation towards the east (on the right-hand side of the figure) in the higher parts of the trees due to the crosswise influence of the breeze.
The 1% coverage limit curve is present on both sides in a position that does not involve the adjacent rows and with an hourglass shape, where its expansion in the lowest part coincides with the lack of vegetation below half a meter in height while proceeding upwards, it is justified by the fact that the trees had fewer leaves in that point.
At the maximum height of our assessments, about six meters, one notes that the coverage only slightly exceeds 1%, confirming the validity of the split dispensing system in the spraying points featured by machine A, designed to reduce the phenomenon of drift.
When it came to losses on the soil, i.e. droplets carried straight to the ground by the air produced by the machine and by liquid dripping from the leaves, even though this latter effect appeared to be extremely limited thanks to the very low volume distributed by this machine, the values in the graph do not exceed 2% coverage in either the inter-row where the machine passed through or in the adjacent rows.

Sprayer C drift and losses on the soil
The graph in figure 9 illustrates the distribution obtained with a 1500 dm³/ha air-carrier sprayer C (atomiser) operating at an average air temperature of 28°C, 58% humidity and 1 m/s wind blowing towards the north-east with a 30° azimuth.

t = 27°C
63% R.H.
wind 0.3 m/s

Figure 10: droplet distribution displayed with the iso-coverage curves, of self-propelled mixed atomiser B operating at 1500 dm³/ha.

It appears evident how random distribution, characteristic of this type of machine, leads to considerable waste which, in this specific case, means over 40% non-coverage at six meters in height.
Although the term is improper, the mist tends to concentrate heavily towards the right, to a much greater extent than the stronger wind blowing when the assessments were made would appear to have been responsible for.
Since it was impossible to direct the air flow, the droplets sprayed towards taller heights probably missed their target as well as reaching several meters above the rows, where the wind was stronger than the value measured at a height of two meters, this owing to the typical trend of the air flow within the limit layer.

When it came to losses on the soil, the degree of coverage was between 5 and 10% in both the treated inter-row and the adjacent rows on both sides, while it exceeded 10% in the successive row on the right and settled almost at 2% in the last inter-row shown in the diagram, again on the right.
The explanation for this could be both fall-out due to the wind blowing towards the right but mostly the dissymmetric distribution provided by atomisers with axial fans, which blow air with a helical motion subsequently affected by the axial component of this motion being deviated by the fixed plate.

By and large however, one should consider that the percentage coverages measured and processed for this last machine operating at 1500 dm³/ha were the result of the impact of droplets in which the active principle was diluted several times more than that of the machine that operated at 150 dm³/ha.
To achieve comparable data and graphs for the two machines from the point of view of dangerousness, not so much of the droplets as the percentage coverages since the comparison was made by means of these latter, the equivalent coverage of the high volume machine had to be established in relation to the dangerousness of the residue.

To achieve this, it was not correct to simply reduce the coverage percentage ten times considering that droplet dilution was ten times that of the low volume machine (note that the dose of active principle used in the tests was the same). This would have been true if the droplets had been the same size in the two cases, i.e. if they had had the same median volume diameter (MVD). In actual fact, the low volume method also featured a size reduction. Thus, in view of the fact that, fluid being equal, this led to an increase in covered surface, the reduction coefficient of the 1500 dm³/ha compared to the 150 was 6.4 considering the two MVD of 203 and 117 μm respectively, values obtained from the data processed by the image analyzer.

Thus, the 40% measured in the upper part had to be reduced by about 6%, while the 10% on the ground became little less than 2, i.e. it was fully demonstrated that the trained jet and, presumably, the electrostatic charge (which provided a 1% coverage) contained drift by almost six times (again with reference to the quantity of active principle).
In the second case, if it was true that sprayer A lost a similar amount of active principle on the soil of the treated inter-row and in the two adjacent inter-rows as sprayer C, it was also true that in the second and third inter-rows on the right, where part of the drift fell to the ground for this latter machine (also structurally dissymmetric as to distribution), there was a total absence of coverage for the trained jet machine and, thus, of active principle.

Sprayer B drift and losses on the soil
Lastly, the diagram in figure 10 illustrates the trend of the iso-coverage curves obtained from use of the 1500 dm³/h mixed atomiser sprayer in climatic conditions featuring a temperature of 27°C, 63% humidity and a 0.3 m/s breeze blowing towards the north-east, with 45° azimuth.

All told, the curves appear to be symmetrical, with the 1% limit curve barely touching the second rows, thus with a fairly contained lateral extension.
Neither does the sprayed liquid appear excessive in the upward direction if compared with that of the previous machine, i.e. it does not exceed 10% at 6 m, corresponding to 1.5% if one considers a 6.8 reduction coefficient in this case in view of the fact that the droplet population with this machine featured a 196 μm MVD.
This meant 50% more active principle in the upward drift than that observed with sprayer A, while it was still better, with a containment factor of 4, than the atomiser. This behaviour, extremely positive in relation to atomiser C although not as good as machine A, was achieved thanks to the better positions of its two distributors, which were supplied independently by two separate centrifugal fans.

On the other hand, losses on the soil were more worrying, with coverages that were very near to 40% in the inter-row along which the machine passed and which, reduced for the purpose of active principle comparison, were almost 6%, i.e. 3 times more than the values of both sprayer A and C.

Conclusion
With regard to distribution dynamics, the low volume trained jet electrostatic charge machine (A) was clearly superior when it came to comparisons amongst the residues left by the three sprayers.
In relation to the mixed atomiser (B) and air-carrier sprayer (C), the upward drift was less than 35 and 85%, respectively.
Losses on the soil along the row where the machine passed through were almost 70% less than machine B and similar to those of machine C for which, however, consistent quantities were observed in the adjacent rows on the right.
This was due to the combined result of it being impossible to correctly direct the air flow and droplets towards the crop, the dissymmetric distribution achieved by this type of machine, which pushes the air with a helical motion, thus deflected in the direction of the propeller (clockwise in this particular case), and the wind, which was actually not very strong.
The wind was also fairly insignificant when the other two machines were tested. However, although this allowed a satisfactory comparison to be made of the machines, it also highlighted the fact that even values of less than 1 m/s cause considerable drift unless the machines are built with new construction criteria, such as those featured by sprayer A.
At the end of an almost entire plant protection campaign in an apply orchard, this machine also proved to be more efficacious than machine B for treatments against aphids and with fungicides while it ensured the same effects in treatments with insecticides.

Bibliography
CESARI A., DAVI’ R., CASTAGNOLI F., FLORI P. (1986) Applicazioni fitoiatriche a basso volume con sistemi di distribuzione di tipo elettrostatico. Atti Giornate Fitopatologiche, 2, 525-534.
CESARI A., FALCHIERI D., SCANNAVINI M., ALVISI G. (1990) Efficacia biologica ed aspetti residuali di applicazioni a basso volume e dosi ridotte di fungicidi. Atti Giornate Fitopatologiche, 3, 371-380.
(*) Research conducted as part of an E.S.A.V. project.
(**) Eng. Friso established the methodology, conducted the field assessments, processed the data in relation to the distribution dynamics and mechanics of the machines, and wrote the text. Prof. De Zanche coordinated the research.

This post is also available in: Italiano (Italian)